

'HoneyMap' Shows Where People Are Being Hacked In Real-Time
Many stories are heard across the globe of people having their sensitive online data compromised; but this vast number of hacks you see and read about, it's been difficult to realise the vast size and scale of how many malware infections there are. This is where 'The HoneyMap' comes in, showing the location of both the victim and culprit in said cyber attacks, all in real time.
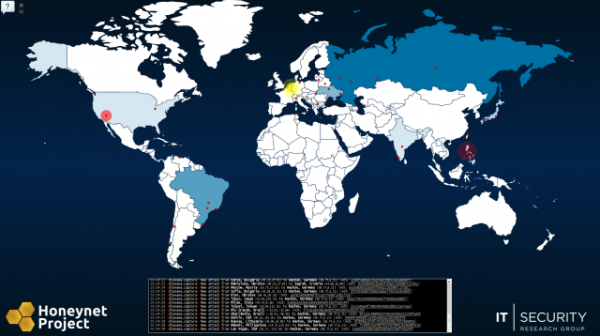
You open up the page and are greeted with a sea of yellow and red dots: yellow representing those who have been hacked, and red showing those doing the hacking. These are all the attacks launched against Honeynet project's sensors, which have been placed across the globe. Using the hpfeed internet sharing protocol they built, data is collected from their honeypot systems and mapped via IP address geolocation.
Before you ponder such a thought, every hacker in the planet is not out to attack the city of Aachen, Germany. Honeypot captures a significantly higher amount of attacks there because of the larger range of IP addresses the system takes note of, meaning it can see more of Aachen than other places on Earth.
With the sparse amount of honeypots placed on Earth, this isn't a representative image of just how many attacks are occurring; but to see both the victim and the perpetrator and the international scale of these hacks is an interesting visual demonstration. So far, while running the site, there has only been 23 in Britain...good for us.
Source: HoneyMap
Jason England